
About
The Corporate notifications section displays data on how users interact with the notifications sent at a corporate level through the app.
In this Insights section, you will find data on devices, user opt-in rates, and a complete conversion funnel to track how effectively your corporate notifications are being delivered and interacted with.
This section is composed of two main subsections, accessible from the left sidebar under Corporate notifications:
- Devices
- Notifications
Before getting started
Make sure you have:
- Access to Insights > Analytics from the top menu.
- A corporate user. Other user types (complex ambassador, third party) do not have access to this section.
- Notifications sent within the selected dates. Otherwise, no data will display. Check this article on how to create and send a corporate notification.
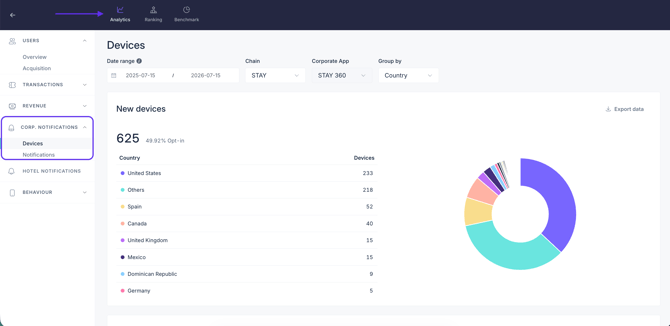
1. Devices
This subsection shows the total number of registered devices, allowing you to know exactly how many users you can reach if you send a notification today. You can segment this data by country or platform, and monitor your overall push permission percentage (Opt-in).
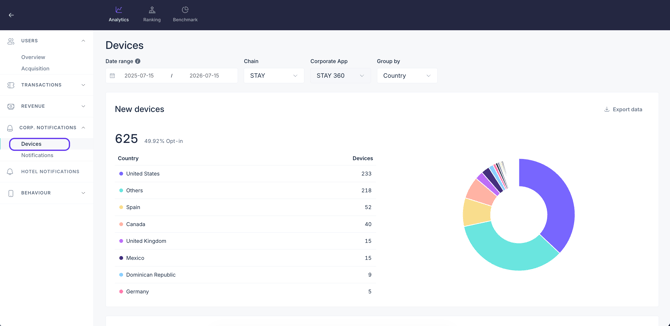
Note: This is a current snapshot of your database. For example, if you check today and see 1,000 devices in a specific country, and you send a notification tomorrow, you might reach 1,020 as new users register.
Step 1: Filter the data you want to view
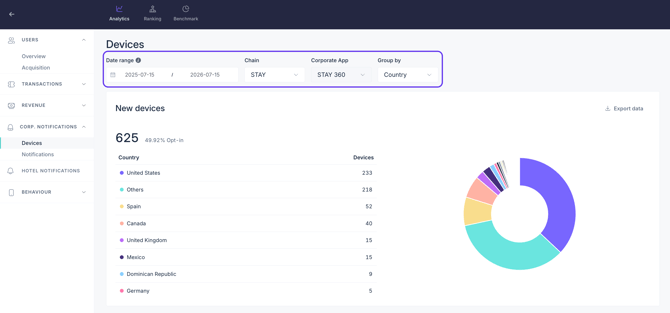
Before analyzing the individual charts, use the top filters to refine the results displayed:
- Date range: Click on the calendar icon to select a specific time period.
- Chain: Filter data by a specific hotel chain name.
- Corporate app: Filter data by a specific corporate app.
- Group by: Use this dropdown to segment the device metrics. You can group results by
- Country. Filters and groups the data by geographic origin, showing a breakdown of all countries where guests' devices are located.
- Platform. Filters and groups the data by operating system and platform, breaking down the metrics specifically into iOS, Android, and Web.
Step 2: Visualize the data
Once the filters are applied, the data is divided in two:
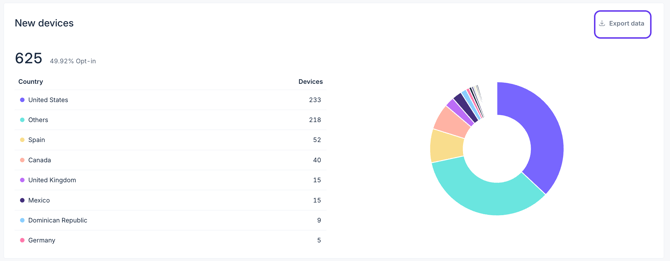
1. New devices
Shows the following charts:
→ List
This breaks down the number of devices that can receive notifications based on your selection in the Group by filter:
- If Country is selected: It displays the device distribution by geographic origin, showing the exact number of devices corresponding to each country.
- If Platform is selected: It displays the device distribution by operating system, showing the exact number of devices corresponding to each platform.
→ Donut chart
This displays the same metrics as the list but in a visual donut chart format based on your selection in the Group by filter:
- If Country is selected: It shows the visual percentage and distribution of devices by country.
- If Platform is selected: It shows the visual percentage and distribution of devices by operating system platform.
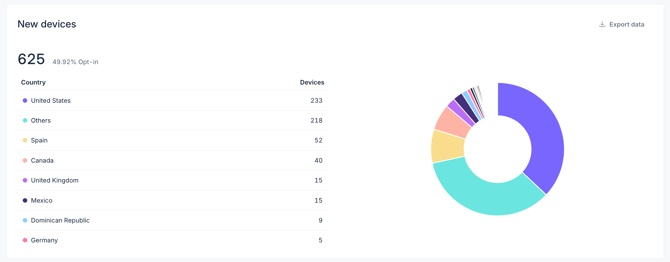
Note: At the top of these two charts, you will find the total of all devices alongside the Opt-in percentage. This percentage represents the rate of users who enabled push notifications over the total volume of new device registrations within the selected period.
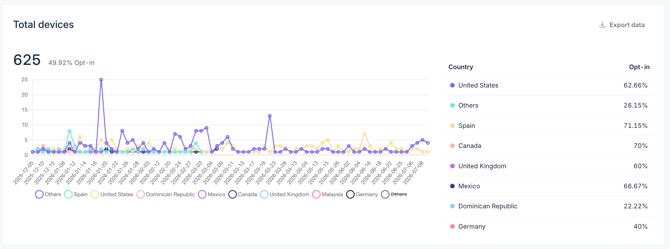
2. Total devices
Shows the following charts:
→ Line chart
Displays the total number of devices that can receive notifications over time. The specific data points on the timeline will adjust based on the time period selected in the Date range filter. This chart also segments data based on your Group by selection:
- If Country is selected: It displays the device trend by geographic origin, tracking the exact number of devices corresponding to each country over time.
- If Platform is selected: It displays the device trend by operating system, tracking the exact number of devices corresponding to each platform over time.
→ Table
This table details the specific push acceptance rate percentage, with the data segmented depending on your Group by selection:
- If Country is selected: It displays the opt-in rate for each country.
- If Platform is selected: It displays the opt-in rate for each platform.
Note: At the top of these two charts, you will find the total of all devices alongside the Opt-in percentage. This percentage represents the rate of users who enabled push notifications over the total volume of new device registrations within the selected period.
Step 3: Download the data
If you need to work with the device data outside the CMS:
- Find the Export data button in the top right corner of the chart or table you want to export.
- Click it to download a .csv file directly to your computer with the exact filtered data you are currently viewing.
2. Notifications
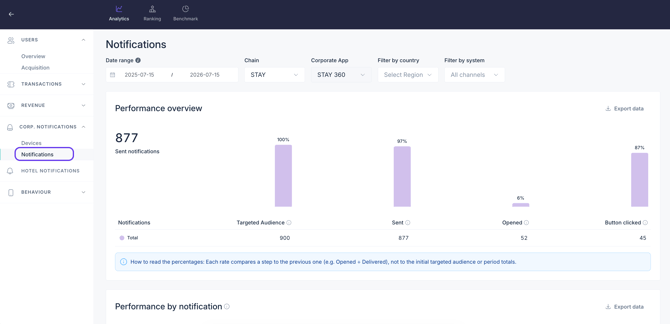
This subsection tracks corporate notification performance through a conversion funnel, following each step of the delivery and engagement process (Targeted audience, Sent, Opened, and Button clicked).
Step 1: Filter the data you want to view
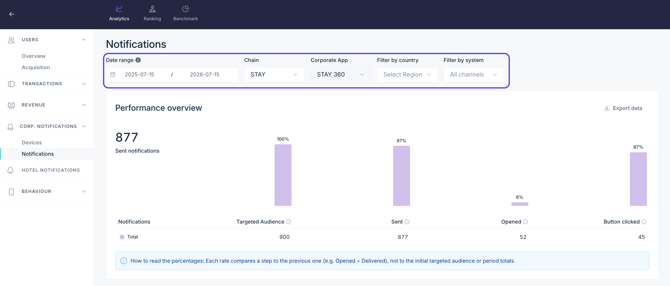
Before analyzing the individual charts, use the top filters to refine the results displayed:
- Date range: Click on the calendar icon to select a specific time period.
- Chain: Filter data by a specific hotel chain name.
- Corporate app: Select the specific corporate app.
- Filter by country: Filters and groups the data by geographic origin, showing a breakdown of all individual countries where your users' devices are located.
- Filter by system: Filter the performance data by operating system (iOS or Android).
Step 2: Visualize the data
Once the filters are applied, the device data is divided in two:
1. Performance overview
Shows the following chart:
→ Bar chart
This chart details the performance of your corporate notifications through a conversion funnel, tracking each stage of the delivery process. These stages are:
- Targeted audience. The total number of devices eligible to receive the notification at the moment it is actually sent (not when the draft is created).
- Sent. Total technical push sendouts delivered to the provider (FCM, APNs, etc.) for devices with active permissions.
- Opened. The number of unique devices that opened the notification to read its contents at least once.
- Button clicked. The number of unique devices that clicked the Call-to-Action (CTA) button inside the notification details. Only one click is counted per device.
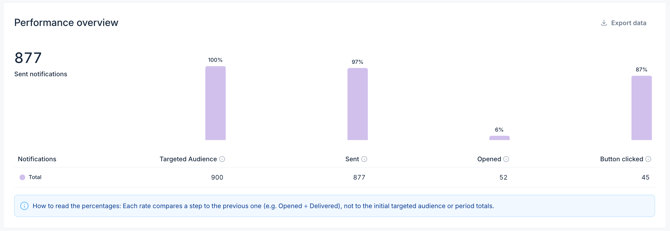
Note: Each rate percentage compares a step to the directly preceding one (e.g., Opened \ Delivered), rather than to the initial targeted audience or overall period totals.
2. Performance by notification
Shows the following chart:
→ Table
This table tracks the breakdown of results for each individual corporate notification. It features the following columns:
- Notification name: The internal name of the notification.
- Targeted audience: The number of users or devices eligible to receive a notification.
- Sent: Total technical push sendouts delivered to the provider (FCM, APNs, etc.) for devices with active permissions.
Note: To be considered eligible, devices must have push permissions enabled (opt-in) and have a valid push token at the time of sendout. - Opened: The number of unique devices that opened the notification to read its contents at least once.
- Open rate: The percentage of sent notifications that were actually opened by users.
- Button clicked: The number of unique devices that clicked the Call-to-Action (CTA) button inside the notification details. Only one click is counted per device.
- CTR: The conversion percentage showing how many of the opened notifications resulted in a button tap.
Step 3: Download the data
If you need to work with the device data outside the CMS:
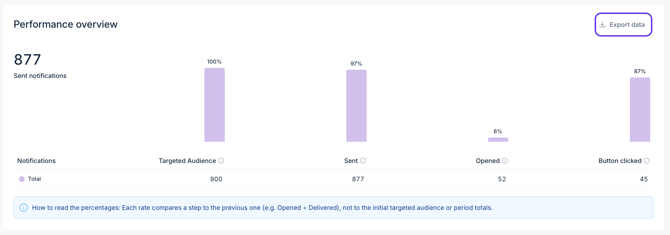
- Find the Export data button in the top right corner of the chart or table you want to export.
- Click it to download a .csv file directly to your computer with the exact filtered data you are currently viewing.
Next steps
Now that you know how to leverage the corporate notifications metrics, we recommend taking the following actions to improve engagement:
- Check the Open rate in your notification table. If it is low compared to the total messages Sent, try using shorter more engaging titles.
- Use the Platform breakdown under Devices to see if your audience mostly uses iOS or Android. Make sure your notification text looks good on the operating system your guests use most.
- Look at the Devices tab. If your Opt-in rate is low, consider explaining to guests why they should enable notifications to receive relevant information.
Need further assistance?
If you have additional questions or require further assistance:
- Contact us via live chat
- Send a ticket to our Support team
- Visit STAY Academy, our training platform.